
By Michael Flory
In the 1960s Alan Lomax, in collaboration with the ethnomusicologist Victor Grauer, the anthropologist Conrad Arensberg, statisticians and others developed Cantometrics, a system for coding the elements of musical style. Their coding system was used on thousands of songs and from that data were extracted both broad song style factors encompassing multiple coded variables and broad patterns of musical style characterizing wide geographic regions.
They were limited both by the statistical procedures of the time and by the slow computers on which they were run. Fifty years later, statistical methods have advanced, vastly more computing power is available to the statistician, and thousands of additional songs have been coded.
Analytic Methods
I am currently replicating the original analyses using such tools as latent class analysis (LCA), which goes beyond the "Q factor" analyses, or subject clustering methods, that produced their geographic regions of song style. LCA and other multivariate methods can use the subtleties of codings that previously had to be reduced in complexity to be analyzed. Our resulting regional clusters have shown very encouraging similarities to the regions obtained in the 1960s. Preliminary examinations of the associations between song style and cultural characteristics have also replicated associations observed fifty years ago by the original Cantometric team.
Analytic Goals
- Use contemporary statistical methods to replicate the Cantometrics clustering analyses of 50 years ago to see whether cultures around the world could be grouped together by similarities in their song styles. (No geographic information is used in the clustering, as we want to see to what extent the style-based clusters correspond to geographic regions without prejudgment.)
- See how cultures' song styles resemble one another. Can composite factors describing song styles be extracted from the many characteristics measured by Cantometrics?
- Determine whether particular song styles coincide with particular characteristics of social life as observed by anthropologists.
How Latent Class Analysis Unearths Song Style Clusters
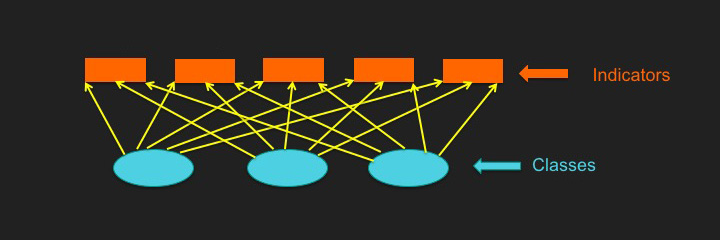
Latent Class analysis posits that songs belong to classes that affect their characteristics in systematic ways. Cantometric codes are taken to be indicators (measures) of these characteristics.
Latent Class Analysis: Class Membership and Indicators
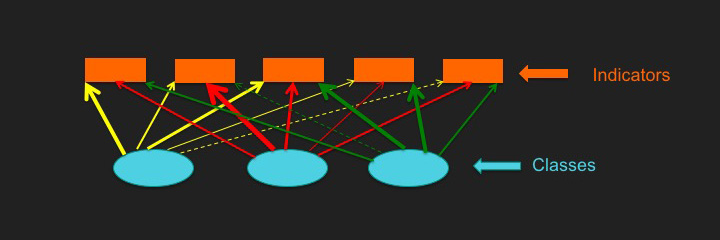
The strength and direction of the effects of class membership on each indicator will differ for each class. The pattern of strengths of effects that best explains the values of the indicators across the set of cases (songs) is computed for each model.
Latent Class Analysis: How Many Classes?
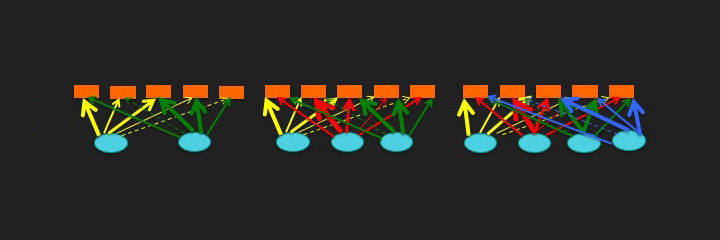
Models with different numbers of classes (clusters of culture groups) can be tested and their ability to predict the observed data can be computed.
Models with 1-30 Classes Were Tested
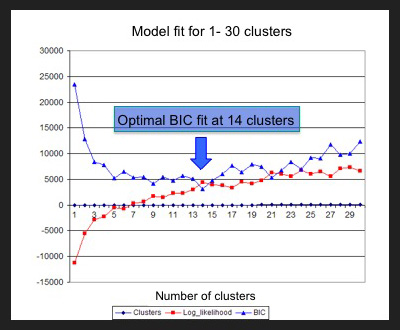
- The log likelihood (LL) measures overall model fit. A model with more classes will usually fit better than one with fewer classes.
- The Bayesian Information Criterion (BIC) also measures overall fit, but it "rewards" a model for having fewer classes (parsimony).
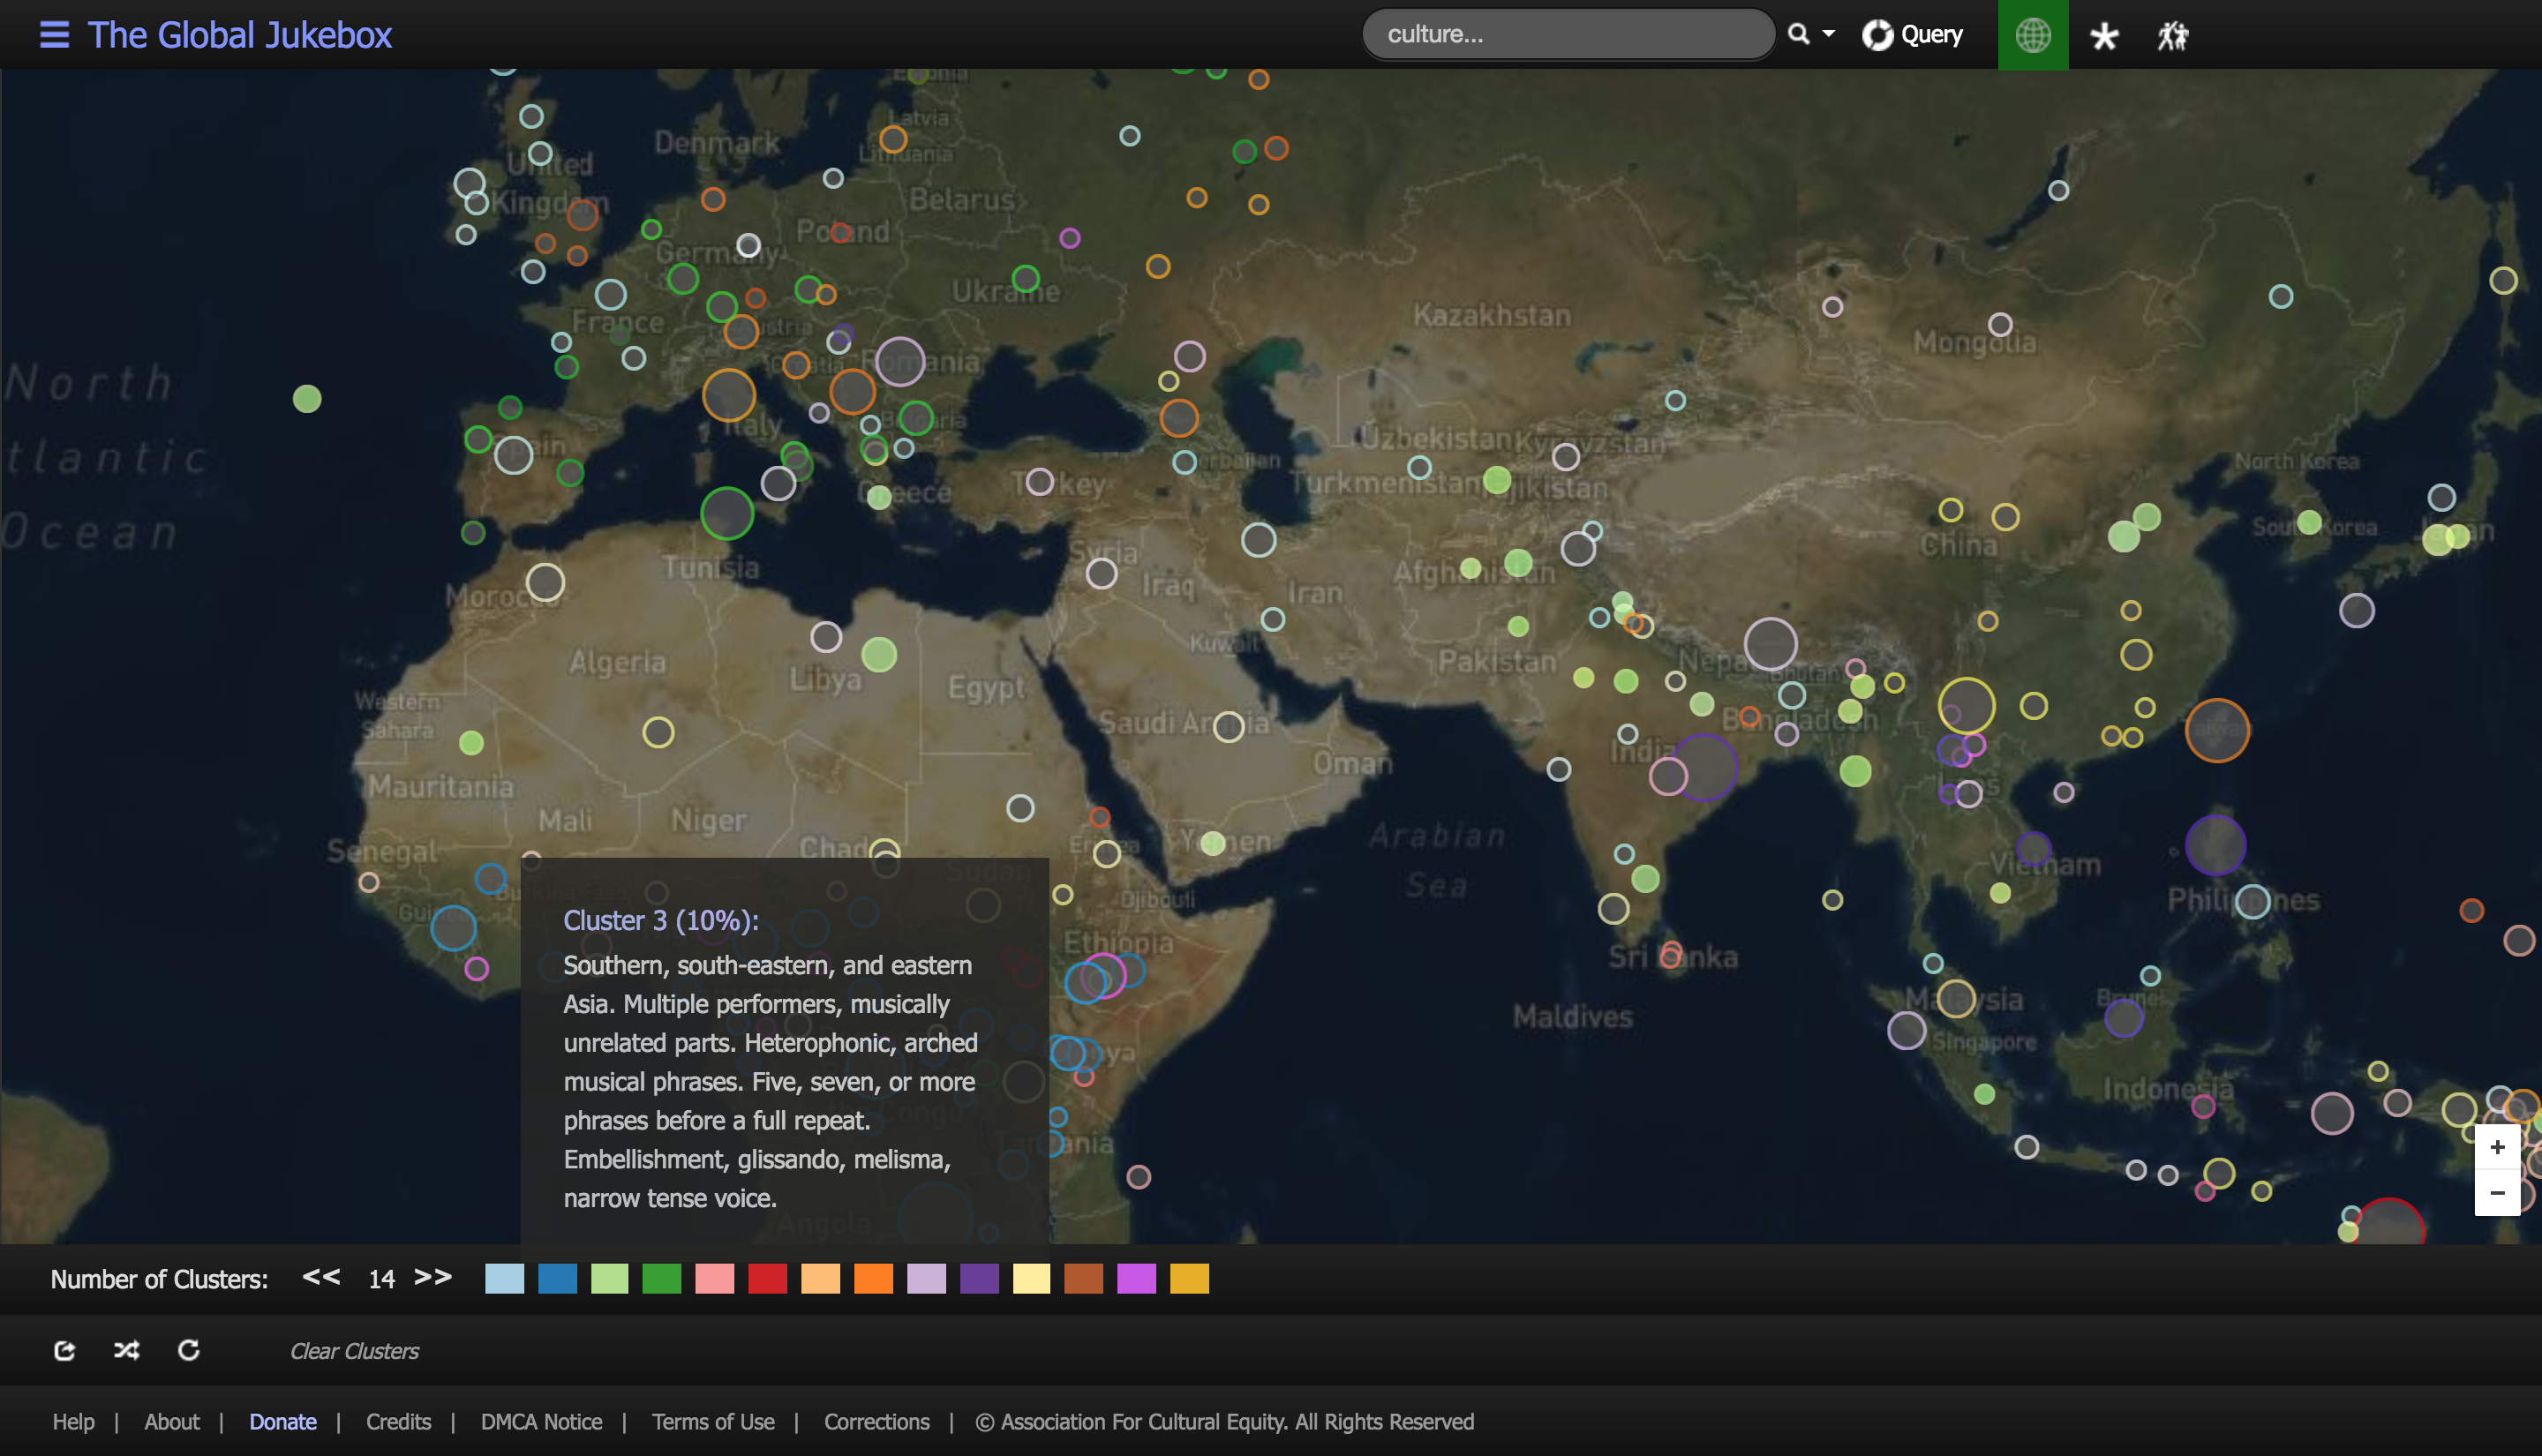
The Map Showing the Computed Song Style Clusters
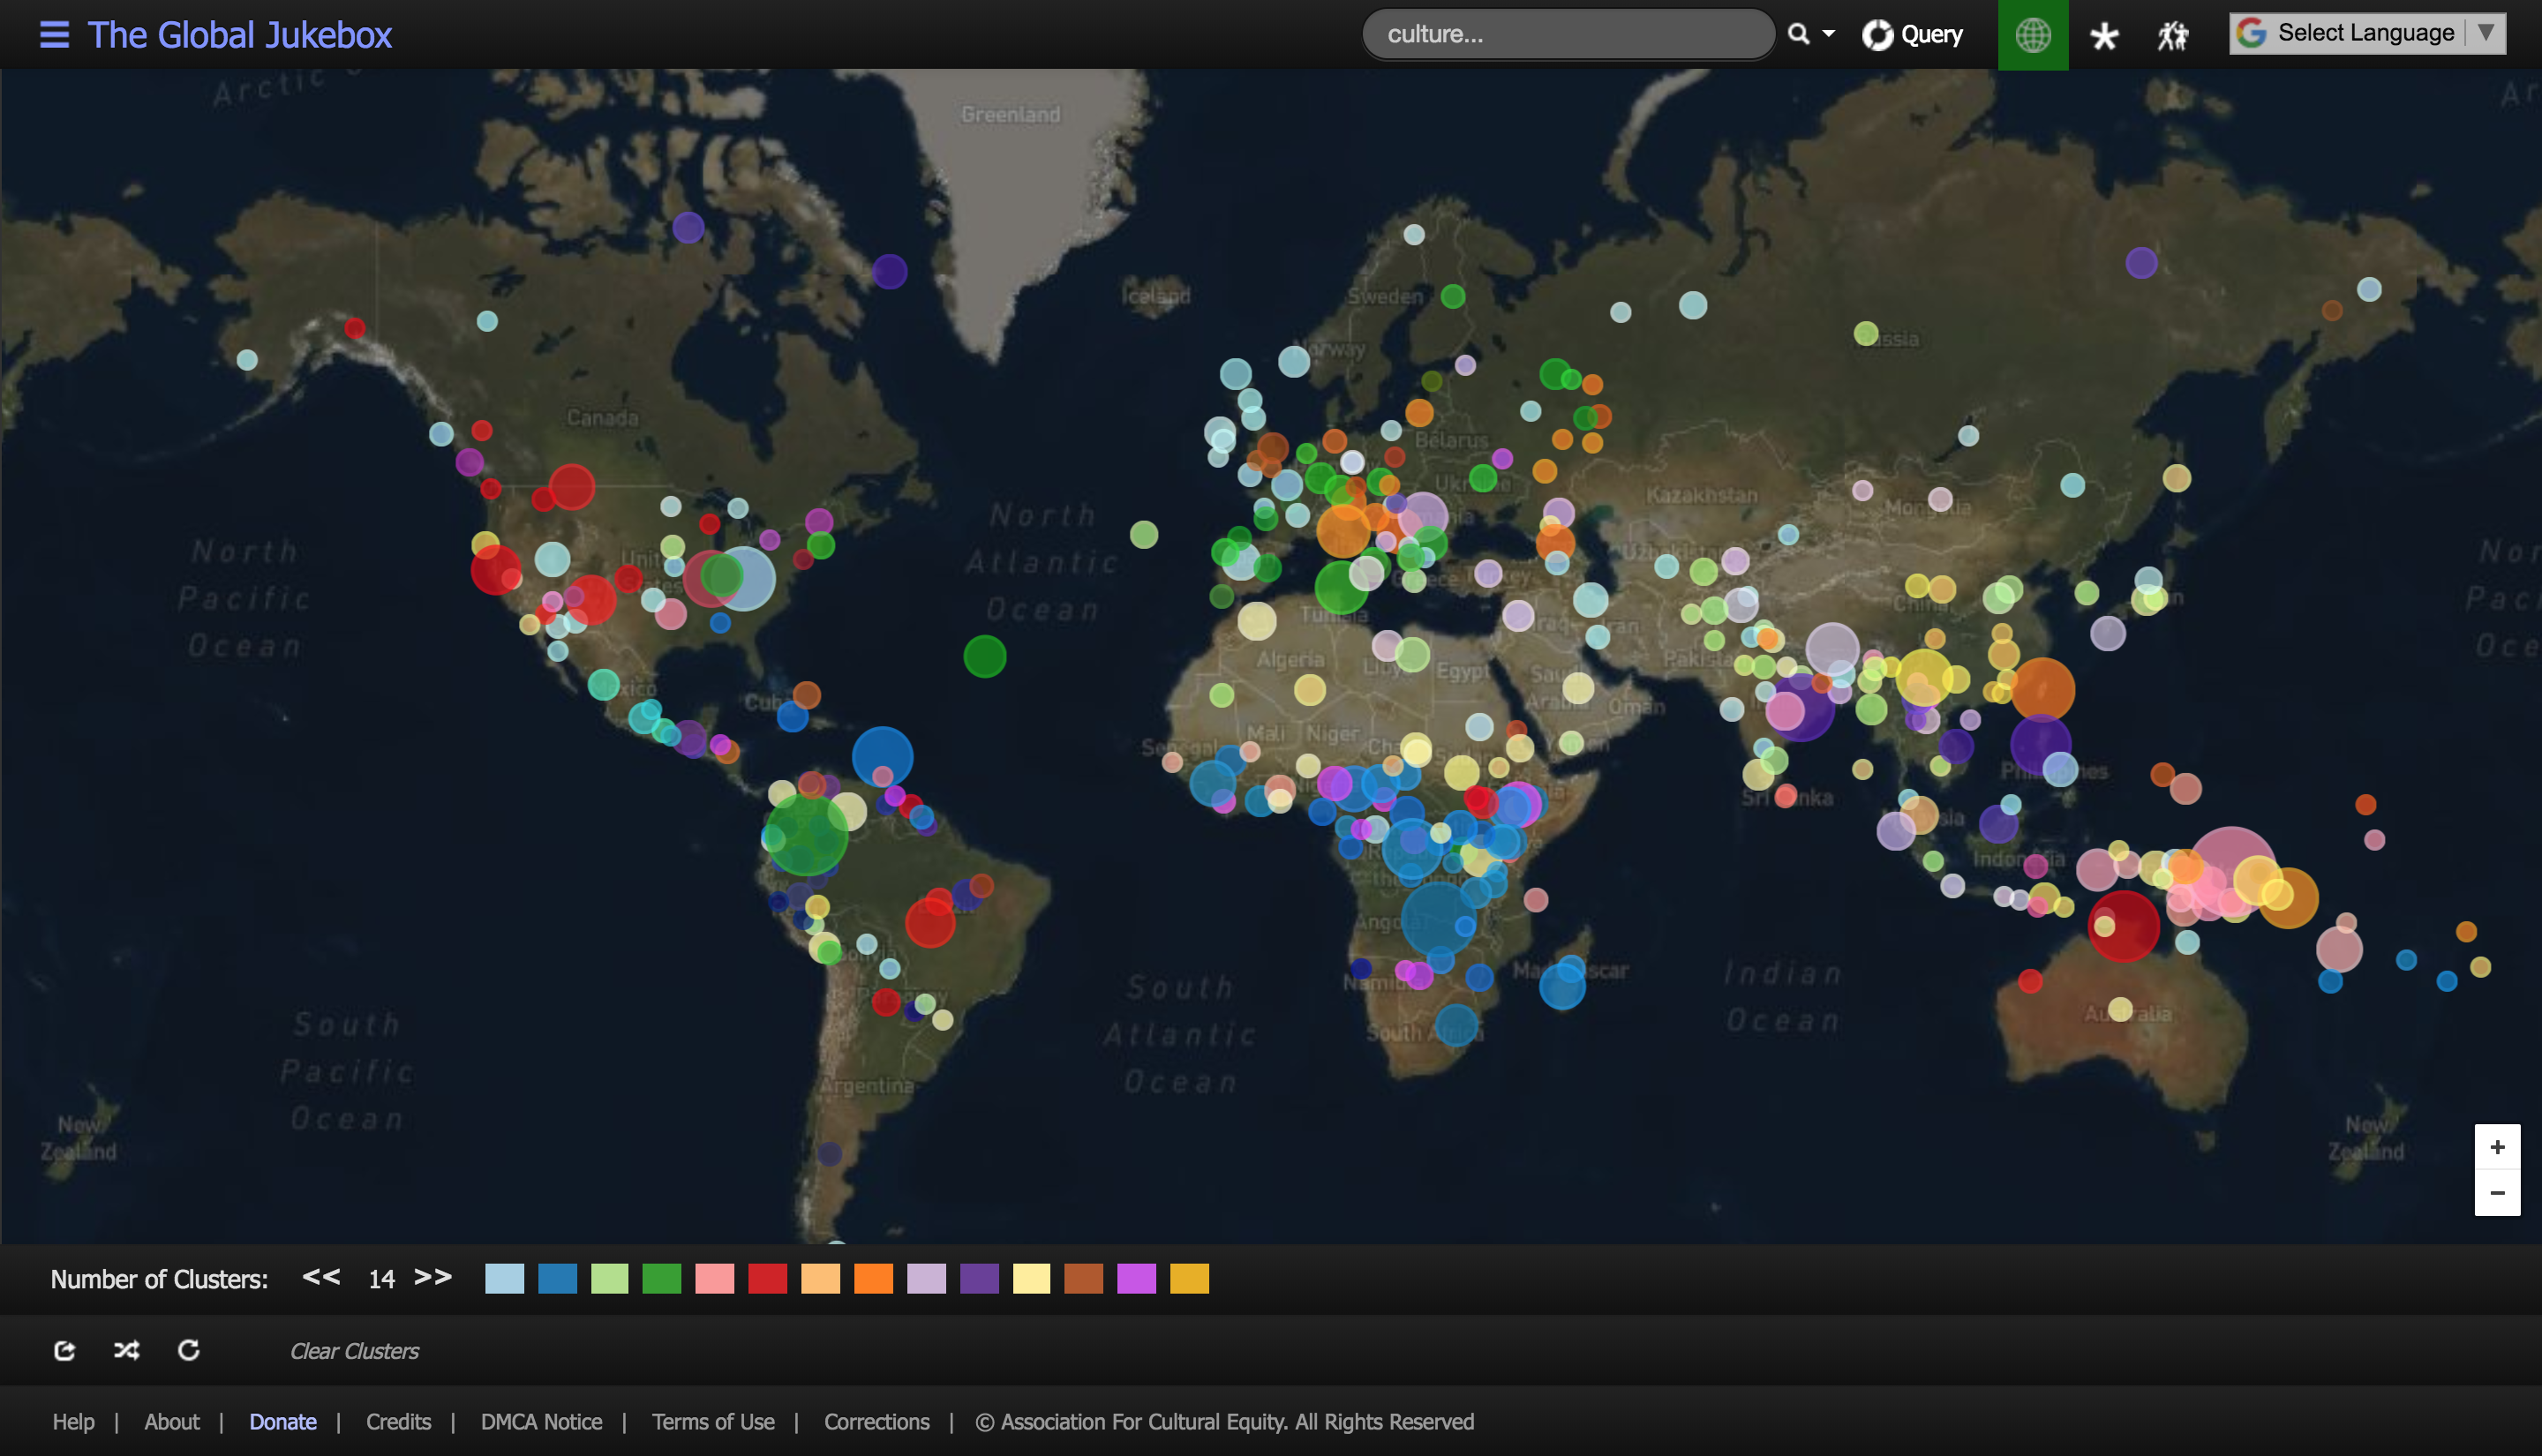
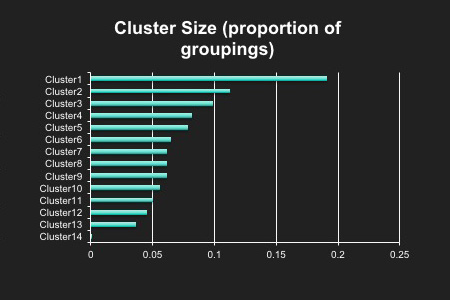
The Clusters are Numbered in Decreasing Size Order
| Cluster 1 | 19% | Cluster 8 | 6% |
| Cluster 2 | 11% | Cluster 9 | 6% |
| Cluster 3 | 10% | Cluster 10 | 6% |
| Cluster 4 | 8% | Cluster 11 | 5% |
| Cluster 5 | 8% | Cluster 12 | 4% |
| Cluster 6 | 6% | Cluster 13 | 4% |
| Cluster 7 | 6% | Cluster 14 | 0% |
Cluster 1 (About 19% of the Cultural Groupings)
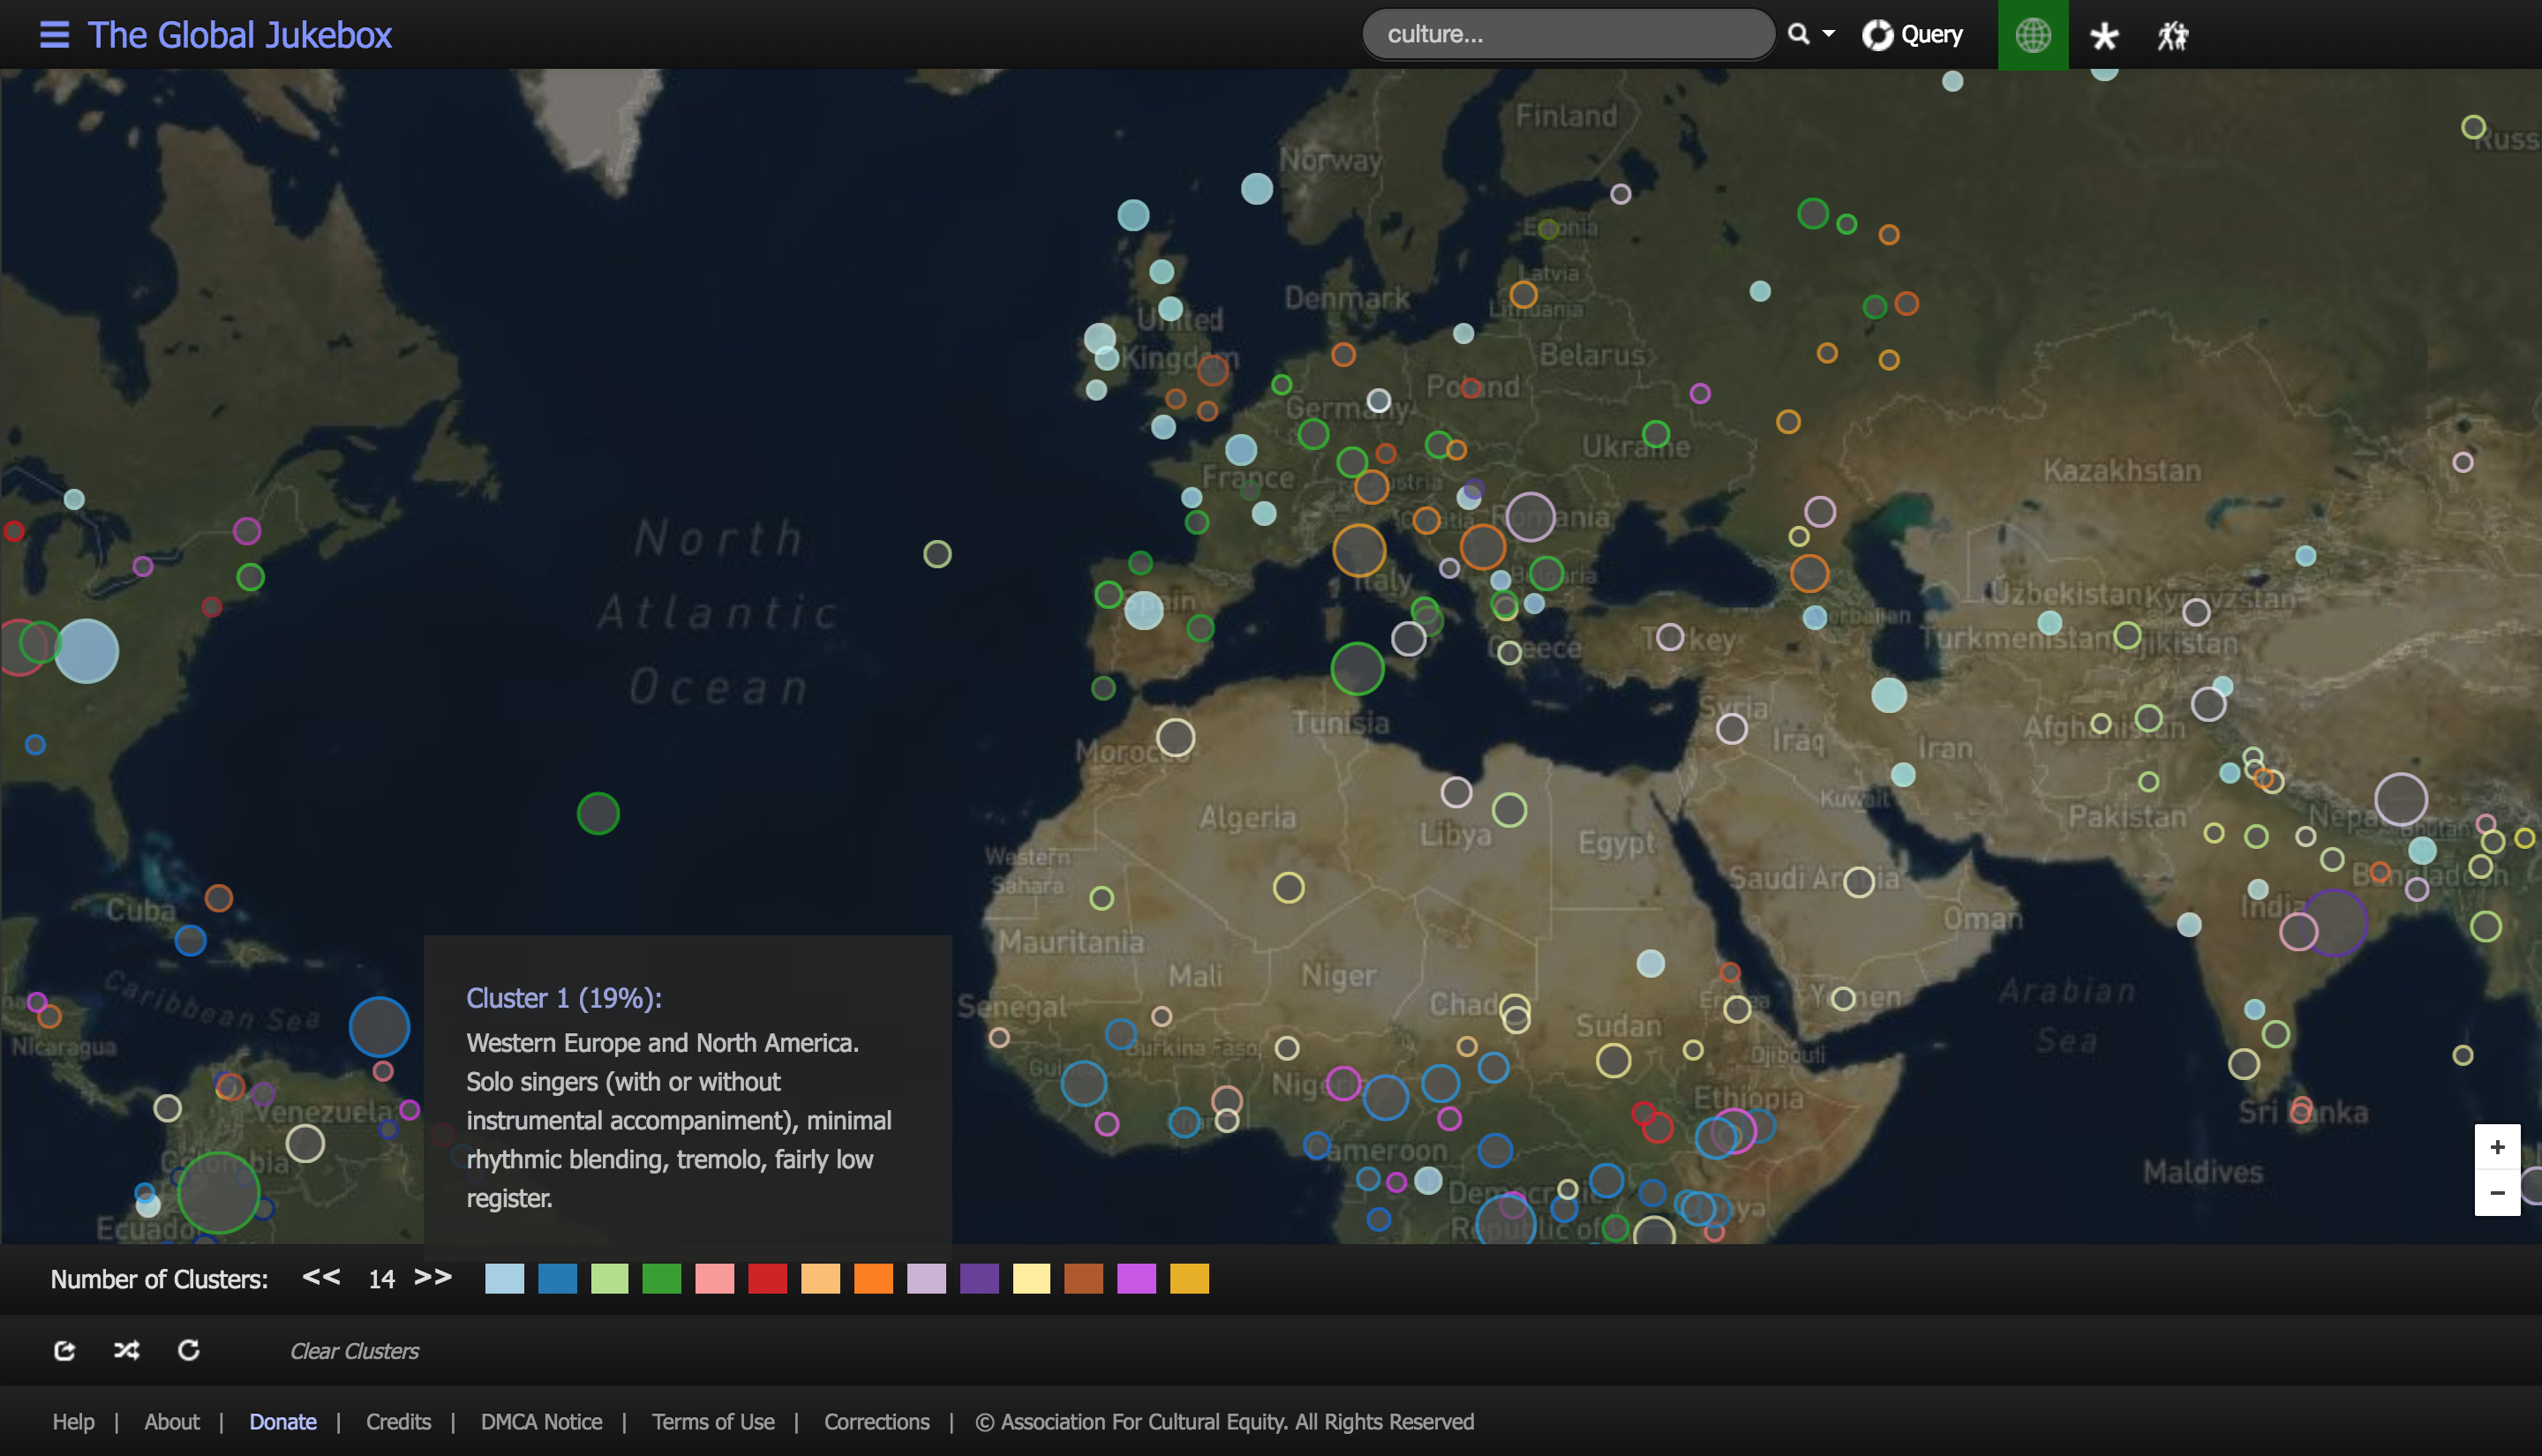
- Predominantly ‐ but not by any means exclusively ‐ found in western Europe and North America
- Solo singers (with or without instrumental accompaniment)
- Minimal rhythmic blending
- Tremolo in the singing
- A fairly low register
The Three Songs Most Representative of Cluster 1
A Dinka song about a powerful Kujur witch doctor, recorded in the Nuba Mountains of the Talod area of Sudan by Roxane Connick Carlisle
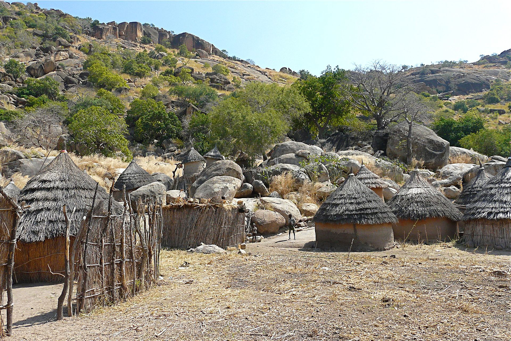
Dinka dwellings, Rita Willaert: Kau and the people of the Nuba mountains - Sudan, CC BY-SA 2.0
Dublin City sung by Seamus Ennis to Alan Lomax in 1951 (on "Songs of Seduction", Caedmon Records, reissued by Rounder Records)
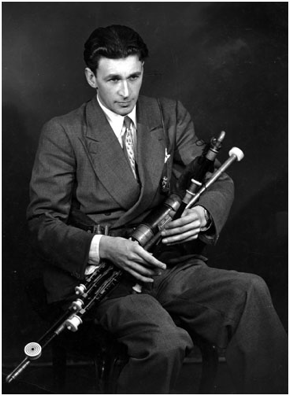
Seamus Ennis, Alan Lomax collection of the United States Library of Congress
A Mapuche song recorded in the Andean area of southern South America
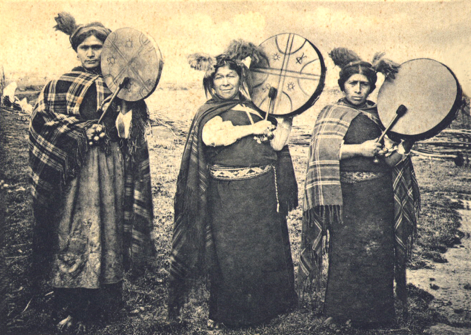
Mapuche musicians, 1900, Sector Carrereni, Chol-chol
The Songs are from Three Continents ... but similar features can be heard in each of them.
Cluster 2 (About 11% of the Cultural Groupings)
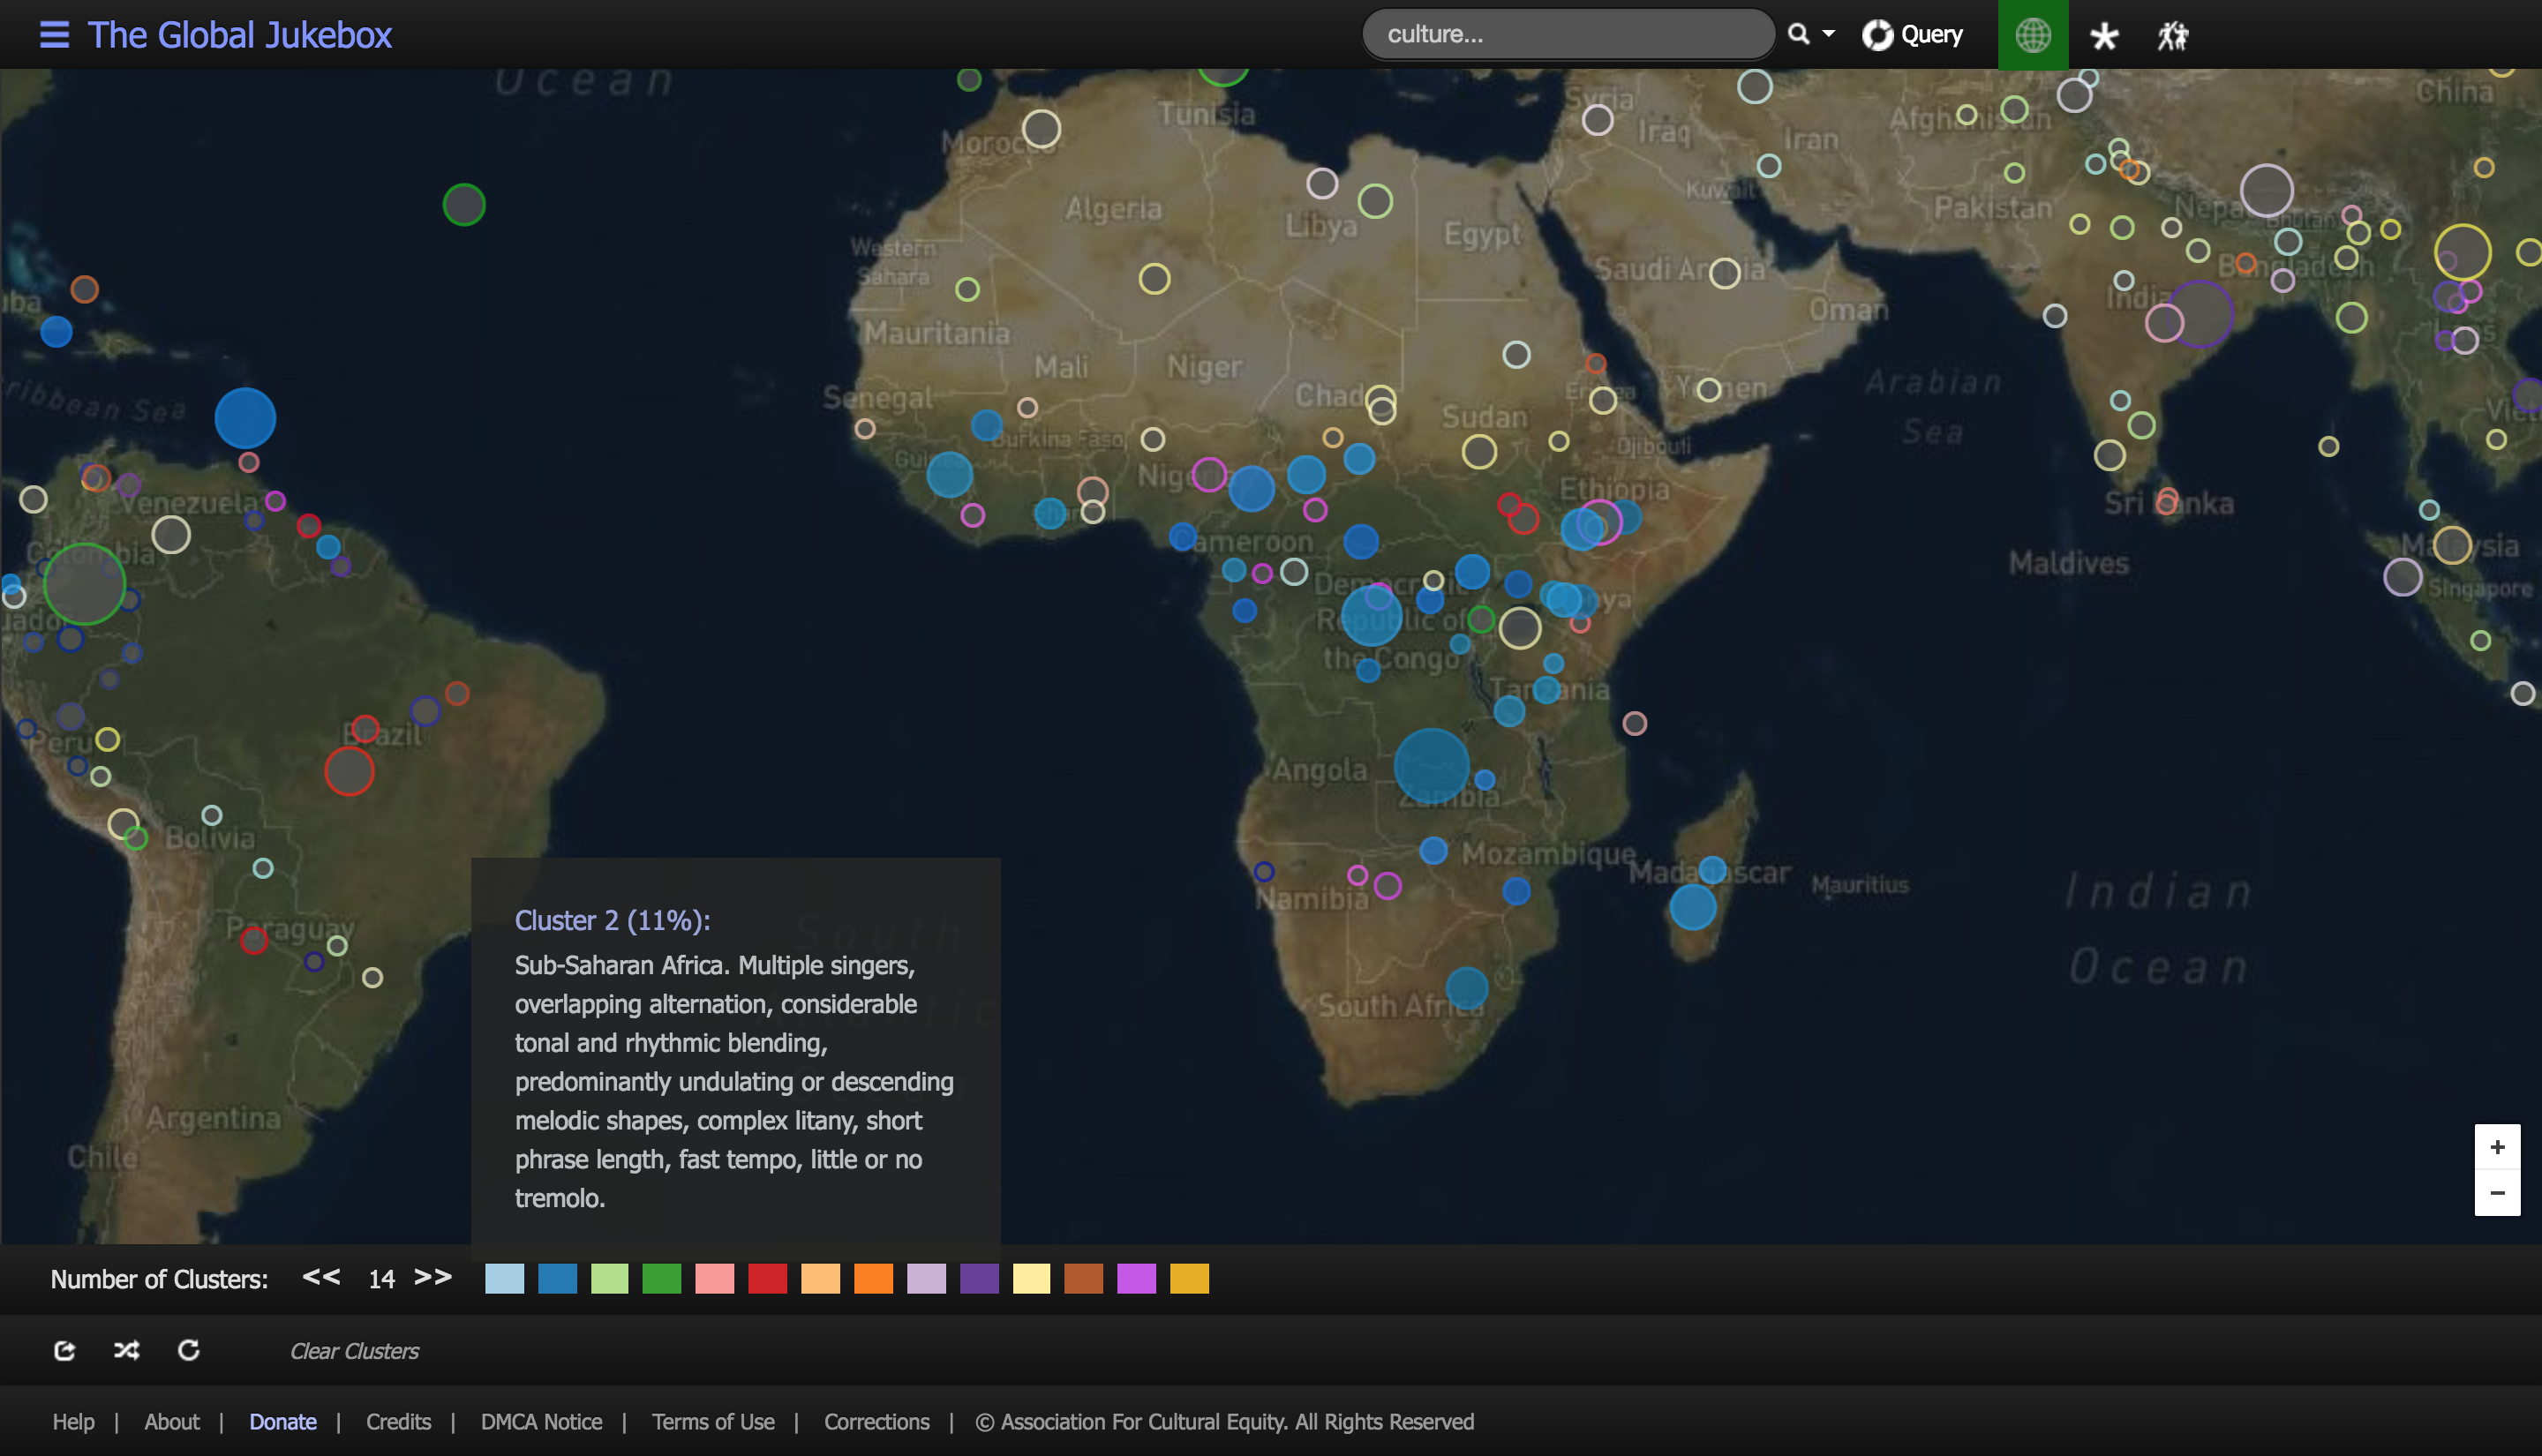
- Predominantly found in Sub-Saharan Africa
- Multiple singers, overlapping alternation
- Tonal & rhythmic blending, undulating or descending melody
- Complex litany
- Short phrases, fast tempo
- Little or no tremolo
Cluster 2 Songs, Sub-Saharan and Diaspora
Women's song recorded by Roxane Connick Carlisle in Akobo, Sudan

Thatched roof earthen walled hut of the Dinka, in Juba, South Sudan. Fabrizio Demartis
Mzeno of Komukomu, Chopi (Mozambique), Int'l. Library of African Music
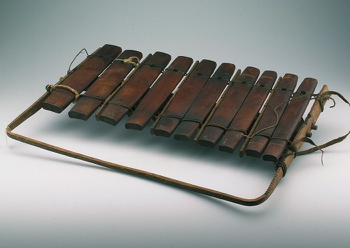
Chopi xylophone, collection of the Tropenmuseum, Amsterdam
Mountain So High, Carriacou (Southern Antilles), recorded by Alan Lomax

View of Hillsborough town and jetty, Carriacou, by Deeferdiving
Cluster 3 (About 10% of the Cultural Groupings)
- South, Southeast, and East Asia ‐and elsewhere
- Musically unrelated singers
- Musicians: same line in different, heterophonic ways
- Phrases rise, fall
- Embellishment
- Glissando, melisma
- A narrow, tense voice
Cluster 3 Songs
Olive Branch, recorded in Lucania, Italy
Arti ritual music, Meitei (Manipur)
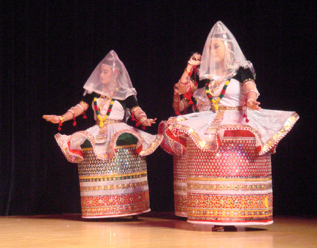
Manipuri dance, by Matsukin
Main Dewo, Petalangan (Malaysia)

Petalangan (Wikipedia)
Cluster 4 (about 8%)
- Western Europe, North & South America, SE Asia
- Words (vs nonsense), little repetition
- Four or eight phrases
- Little glissando, glottal shake, nasality, raspiness
- Consonants clear
Cluster 5 (about 8%)
- Papua New Guinea, some in central India
- Rhythmic, vocal unison
- Chords isolated, two chords rarely follow each other
- Vocal range is limited
- Glottal shake is uncommon
Cluster 6 (about 6%)
- Western North America
- Unison; instruments play one note or octaves at once
- Repetition or nonsense, usually with 1st syllable accented
- Melody tends to descend
- Odd numbers of phrases
Cluster 7 (about 6%)
- Malaysia, Indonesia, Sakhalin, west coast North America
- Singers overlap, heterophony
- Droning polyphony
- One or two phrases, symmetric
- Nonsense or repeated syllables
Cluster 8 (about 6%)
- Italy, Caucasus, Urals, elsewhere
- Vocalists tonally, rhythmically blended
- Instruments (if any) are uncoordinated
- Words rather than nonsense syllables
- Harmony, counterpoint, and drone polyphony
- Vocal range wide
Cluster 9 (about 6%)
- E Europe to Libya, Mongolia to Malaysia
- Soloist in a slow tempo
- Rubato, glissando, melisma, tremolo, glottal shake
- Register is high, vocal width somewhat narrow
Cluster 10 (about 6%)
- Mexico-Northern S America, S & SE Asia
- Soloist, no or uncoordinated instruments
- Tonal range restricted to a monotone or minor or major second
- Register is fairly low
Cluster 11 (about 5%)
- Sub-Saharan Africa, Algeria, Saudi Arabia, India, S America
- Litanies with heterophony of voices and rhythm
- Restricted vocal range ending on a low note
Cluster 12 (about 4%)
- England, Germany, elsewhere
- Unison, often polyphony, simple, regular meters
- Four or eight (or three or six) phrases, symmetric
- Isolated/parallel chords, little vocal embellishment
Cluster 13 (about 4%)
- Sub-Saharan Africa
- Melodically complementary parts
- Nonsense syllables, consonants slurred
- Polyrhythms, rhythmic counterpoint
- Register high, great vocal width
Cluster 14
- Cluster 14 is not the modal cluster of any group. It is a less-likely cluster with extreme values of many factors
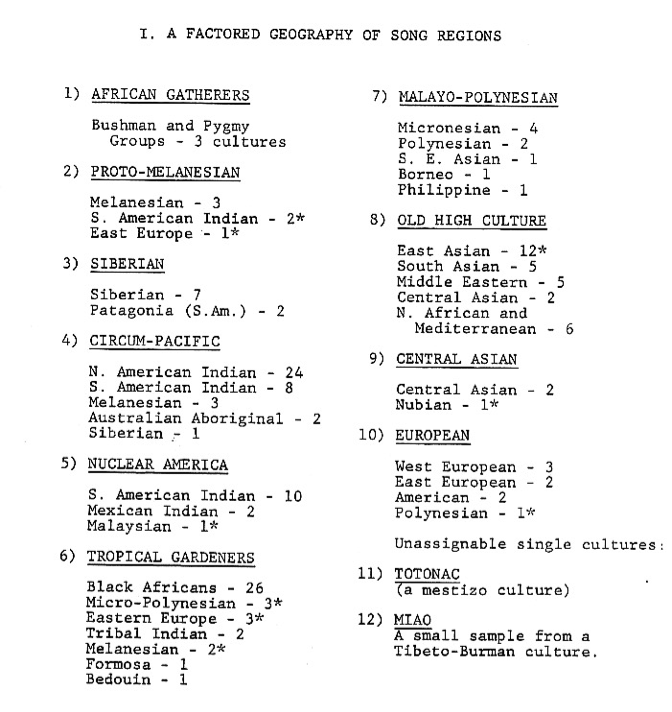
Original Cantometric Regions
A comparison with the "factored geography of song regions" in the Cantometrics handbook shows broad similarities and specific differences from the patterns seen in the more recent analyses. Interestingly, the Totonac and the Miao did not fit any of their clusters. The latent cluster analysis places the Totonac in Cluster 12 and the Miao in Cluster 10.
Totonac (Funeral Song, S. Rosa)
Miao (Work Song, Festive Song)
Other Analyses: Factors of Musical Style
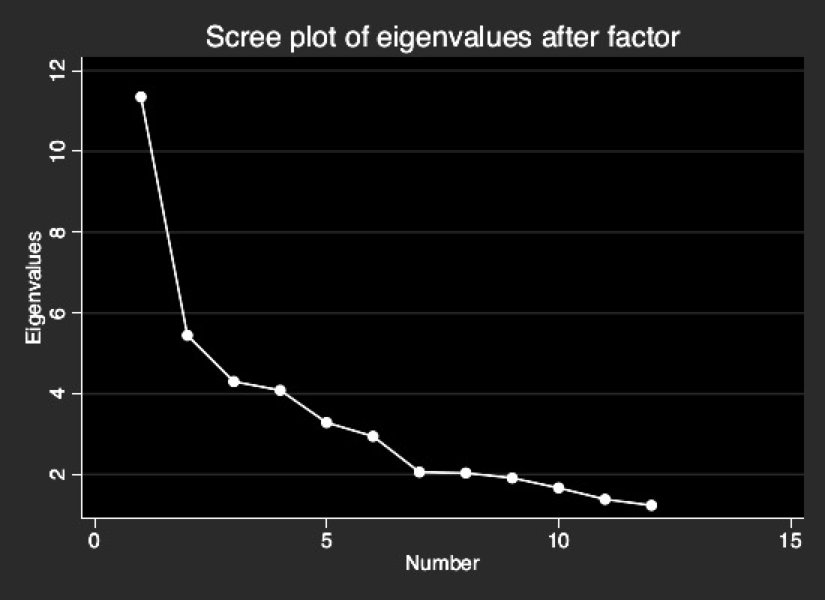
Factor analysis (extracting what were once called "R factors") attempts to find weighted combinations of variables that can explain the variance among indicators (here, Cantometric codings).
A factor analysis of the codings shows that at least a dozen factors can be extracted from the data. The eigenvalue shows how much of the variance among coding values can be captured by that factor. A factor with an eigenvalue greater than one is conventionally considered to be worth retaining.
The Sometimes-Heterogeneous Nature of the Factors
- Each factor gives a weight to every cantometric measurement, but for each factor certain measures take on great importance.
- The first factor takes into account the rhythmic coordination and tonal blend of the vocal group, the degree of polyphony in the vocal part, and to a lesser extent the degree of embellishment and the vocal width.
- The second factor considers vocal and rhythmic heterophony, absence of glissando, melisma, and other embellishments, and a melody in the form of a simple strophe.
- The third factor involves the repetitiousness of the text and to a lesser degree slurring of consonants, simplicity of structure, and limitation of the vocal range.
- The fourth factor features an absence of rhythmic unison and patterning, presence of vocal interlock and a canon or rondo form with vocal solos.
- The fifth factor emphasizes maximal rhythmic coordination in both vocals and orchestration, coupled with an uncoordinated or solo musical organization.
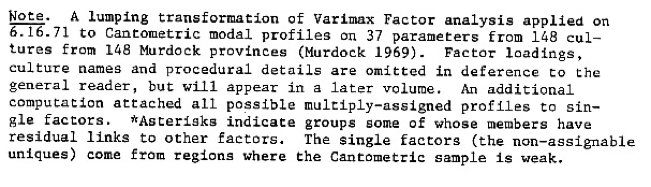
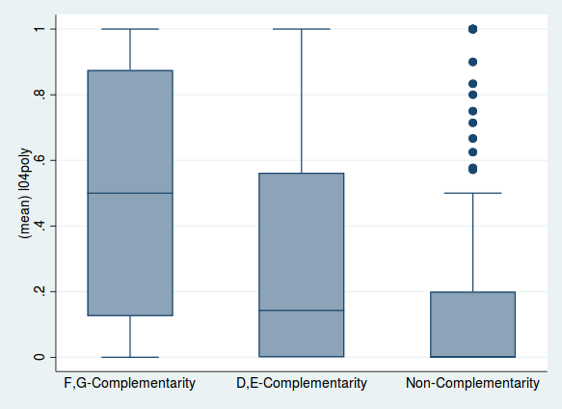
Other Analyses: Correlations Between Song Style and Culture
"Polyphony and complementarity. Both polyphony in general and polyphony in female choruses rise in direct proportion to the degree of feminine involvement in subsistence labor."
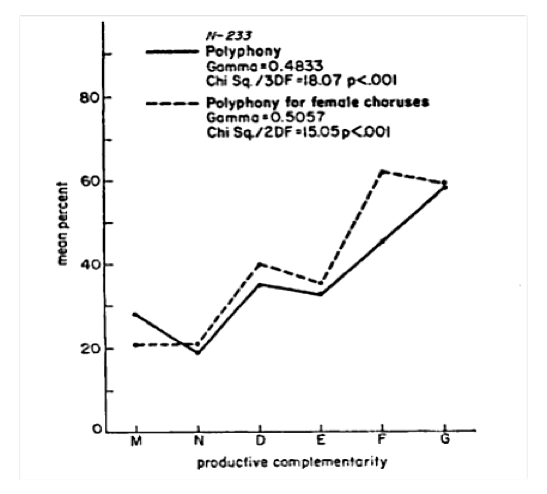
Chart from Folk Song Style and Culture, p. 167.
Note that the direction of the x axis is reversed from that of the earlier chart.
Future analyses
- Refinements of clustering analyses: how do clusters of individual cultures or of individual songs differ from clusters of cultural groups?
- Further factor analyses of cantometric measurements: how to factors derived from present data set differ from those computed on original data set?
- Analyses of correlations between song style and characteristics of culture: will the greater power of modern techniques detect further relationships?
- Comparison of regional characteristics of song styles with studies of ancient migrations and of genetic makeup of present-day and historical populations: are similarities in song style due to styles passed along through the generations, styles passed along via intercultural contacts, or even independent but parallel development?